Overview
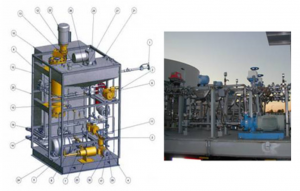
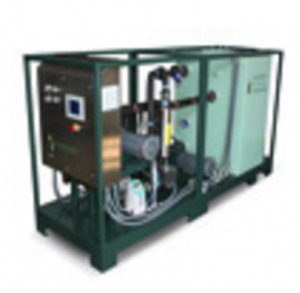
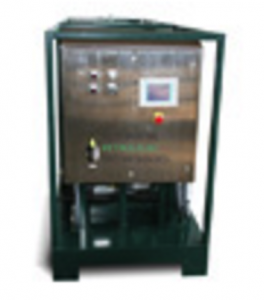
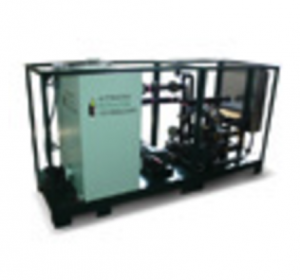
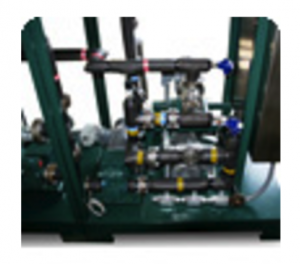
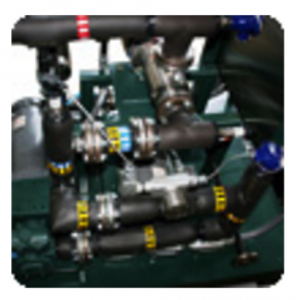
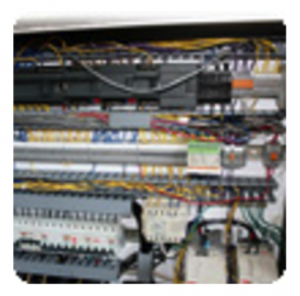
A process control unit (PCU) controls the blending unit which is designed from fairly standard and readily available over-the-counter supplies. Operating ranges for the Blending Units are pre-programmed into the ladder logic system of the PCU from each product stream and can be remotely monitored. Simple and scalable design allows for inexpensive and convenient outsourcing to select qualified fabricators around the world who meet APT’s strict criteria.
Illustration of Blending Unit
|
|||||||
Sample APT FOE Blending Unit
|
|||||||
Selected Testing Results of APT Products
CARB Emission Testing Results for APT DOE
The following are testing results from the Southwest Research Institute under the California Air Resources Board Alternative Diesel Testing Procedures. All transient emission tests were conducted according to EPA Federal Test Procedures (FTP) specified in CFR 40, Part 86, Subpart N.
Figure 1a: CARB Testing – DOE PM Emissions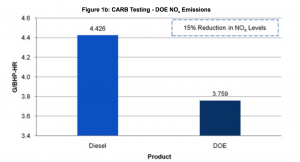
Figure 1b: CARB Testing – DOE NOx Emissions
International Oil Company Carbon Emission Testing Results for Diesel Oil Emulsions
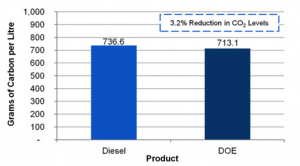
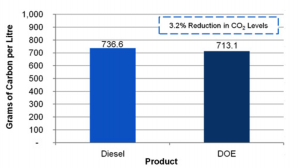
The following are results of an analysis of fuel consumption data from DOE trials of an international oil company.
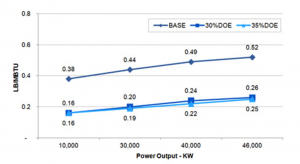
Figure 2: DOE Carbon Emissions
Environmental Protection Agency Testing Results for APT FOE
The following are testing results performed on a 2.5 million Btu/hour North American Package Boiler pursuant to the EPA’s Enviromental Technology Verification program at Research Triangle Park.
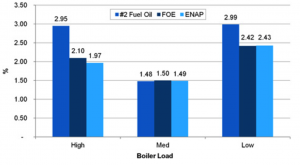
Figure 3a: EPA Testing – Excess Air
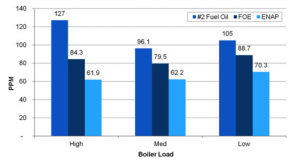
Figure 3b: EPA Testing – Nitrous Oxide Emissions
Tennessee Valley Authority Combustive Turbine Testing Results for APT DOE
The following are testing results conducted with the Tennessee Valley Authority at the Colbert Steam Plant on a General Electric 54 MW Combustion turbine.
Figure 4a: TVA Testing – DOE Power Output
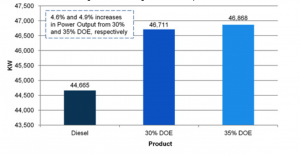
Figure 4b: TVA Testing – DOE NOx Emissions
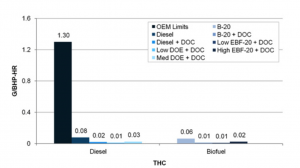
SWRI Emission Testing Results for APT EBF
The following are testing results at the Southwest Research Institute under screening procedures, tested in accordance with transient emission tests according to EPA FTP specified in CFR to Part 86, subpart N.
Figure 5a: SWRI Testing – Biodiesel NOx Emissions
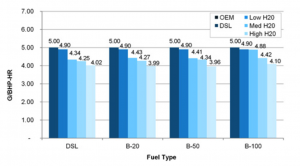
Figure 5b: SWRI Testing – Biodiesel PM Emissions
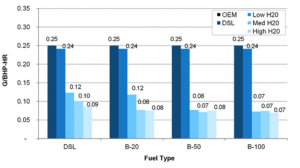
Figure 5c: SWRI Testing – DOC Diesel PM Emissions
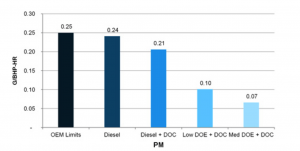
DOC – Diesel Oxidation Catalyst
Figure 5d: SWRI Testing – DOC Biodiesel PM Emissions
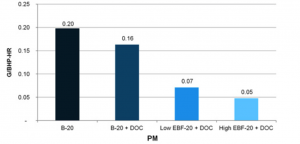
DOC – Diesel Oxidation Catalyst
Figure 5e: SWRI Testing – Diesel and Biodiesel NOx Emissions
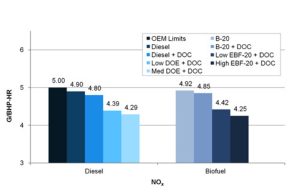
Figure 5f: SWRI Testing – Diesel and Biodiesel CO Emissions
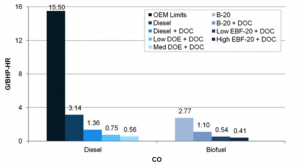
Figure 5g: SWRI Testing – Biodiesel THC Emissions
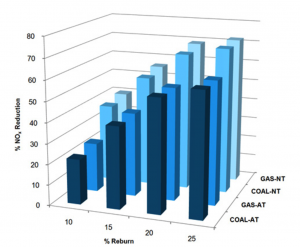
Energy and Environmental Research Corporation Testing Results for APT FOE
The following are bunch scale testing results from the Energy and Environmental Research Corporation facility in California, which evaluated the potential of APT FOE as a reburn fuel in an electricity scale application.
Figure 6: EERC Testing – NOx Reductions with FOE Reburn
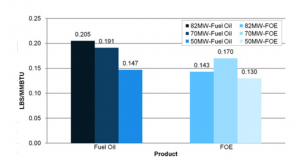
Utility Company Demonstration Testing Results for APT FOE
The following are testing results from commercial testing performed on 82 MW oil-fired boiler at a major utility company in the North East United States. The emulsions were blended on-site at the utility company.
Figure 7: Utility Company Testing – FOE NOx Emissions
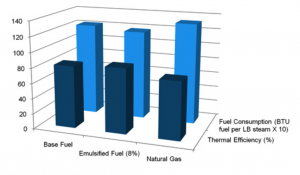
Commercial Site Testing Results for APT ROE
The following are testing results obtained from commercial operations of 250 HP industrial fire-tube boilers. The below figure illustrates the fuel consumption and thermal efficiency results.
Figure 8: Commercial Site Testing – ROE Fuel Consumption Comparison